Insight using TAGS
TAGS also generates several summary graphs, providing you with some basic insight from the data you just scraped from Twitter. The graphs can be found by clicking the 'Dashboard' tab (located at the bottom of google sheets). The summaries provided use all of the data contained in the 'Archive' tab. Thus, you if you run more than one scrape or set TAGS to run every hour, the graphs will be updated as new data is pulled into your archive.
Here are the graphs generated by TAGS:
- Top Tweeters: This graph shows the users in your archive that have posted the most number of Tweets.

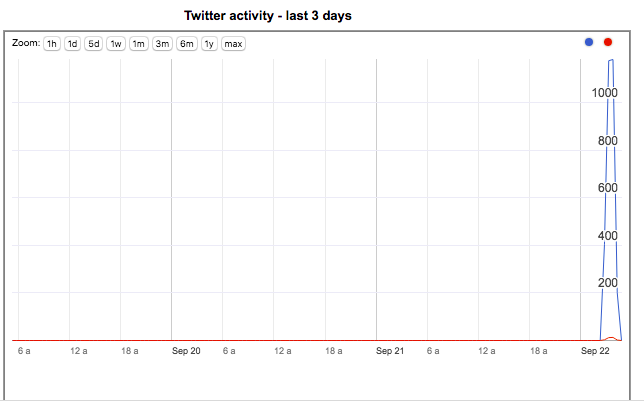
- Twitter activity - last 3 days: This graph shows the number of Tweets posted each day.
- Tweets with the most Retweets from the last 1-2 days:

- TAGSExplorer: this creates an interactive network graph allowing you to explore conversations. Nodes represent the Twitter users, solid lines show direct replies between two users and dashed lines connect two users (e.g. "@ResBaz Thanks for a great conference!), where one user has mentioned the other user in a Tweet (e.g. For a great conference on digital tools, go to @ResBaz's conference!"). The size of the node represents the number of @replies and @mentions. Clicking on individual nodes brings up a panel on the right showing all Tweets posted by individual users, including @replies and @mentions of them. There is also a playback option which allows you to see how a converstation evolves! Martin Hawksey has made a video showing how this works here.
- TAGS archive: this link takes you to a Twitter archive interface which allows you to search your archive by Tweet or Screen name.
A lot of great research is already being done with Twitter data obtained using TAGS! For inspiration, here is a taster of some:
- Nand and colleages from the University of Auckland investigated cyberbulling by obtaining tweets containing typical bullying keywords over a period of 2 months. Supervised machine learning techniques were then assessed on their ability to predict bullying cases. Read their paper here.
- Shutler and colleagues from New York explored opioid prescription drug epidemic by using sentiment analysis on tweets about opioid use. Read their paper here.
- Kumar and colleagues from Buffalo, USA examine the spread of misinformation and propaganda on Twitter by looking for deception cues. Tweets relating to natural disaters, terrorism and political events were obtained. Read their paper here.
- Finally, Stephens and colleagues from Melbourne studied sources of roadrage by collecting Tweets over a 13 month period! Read their paper here.